
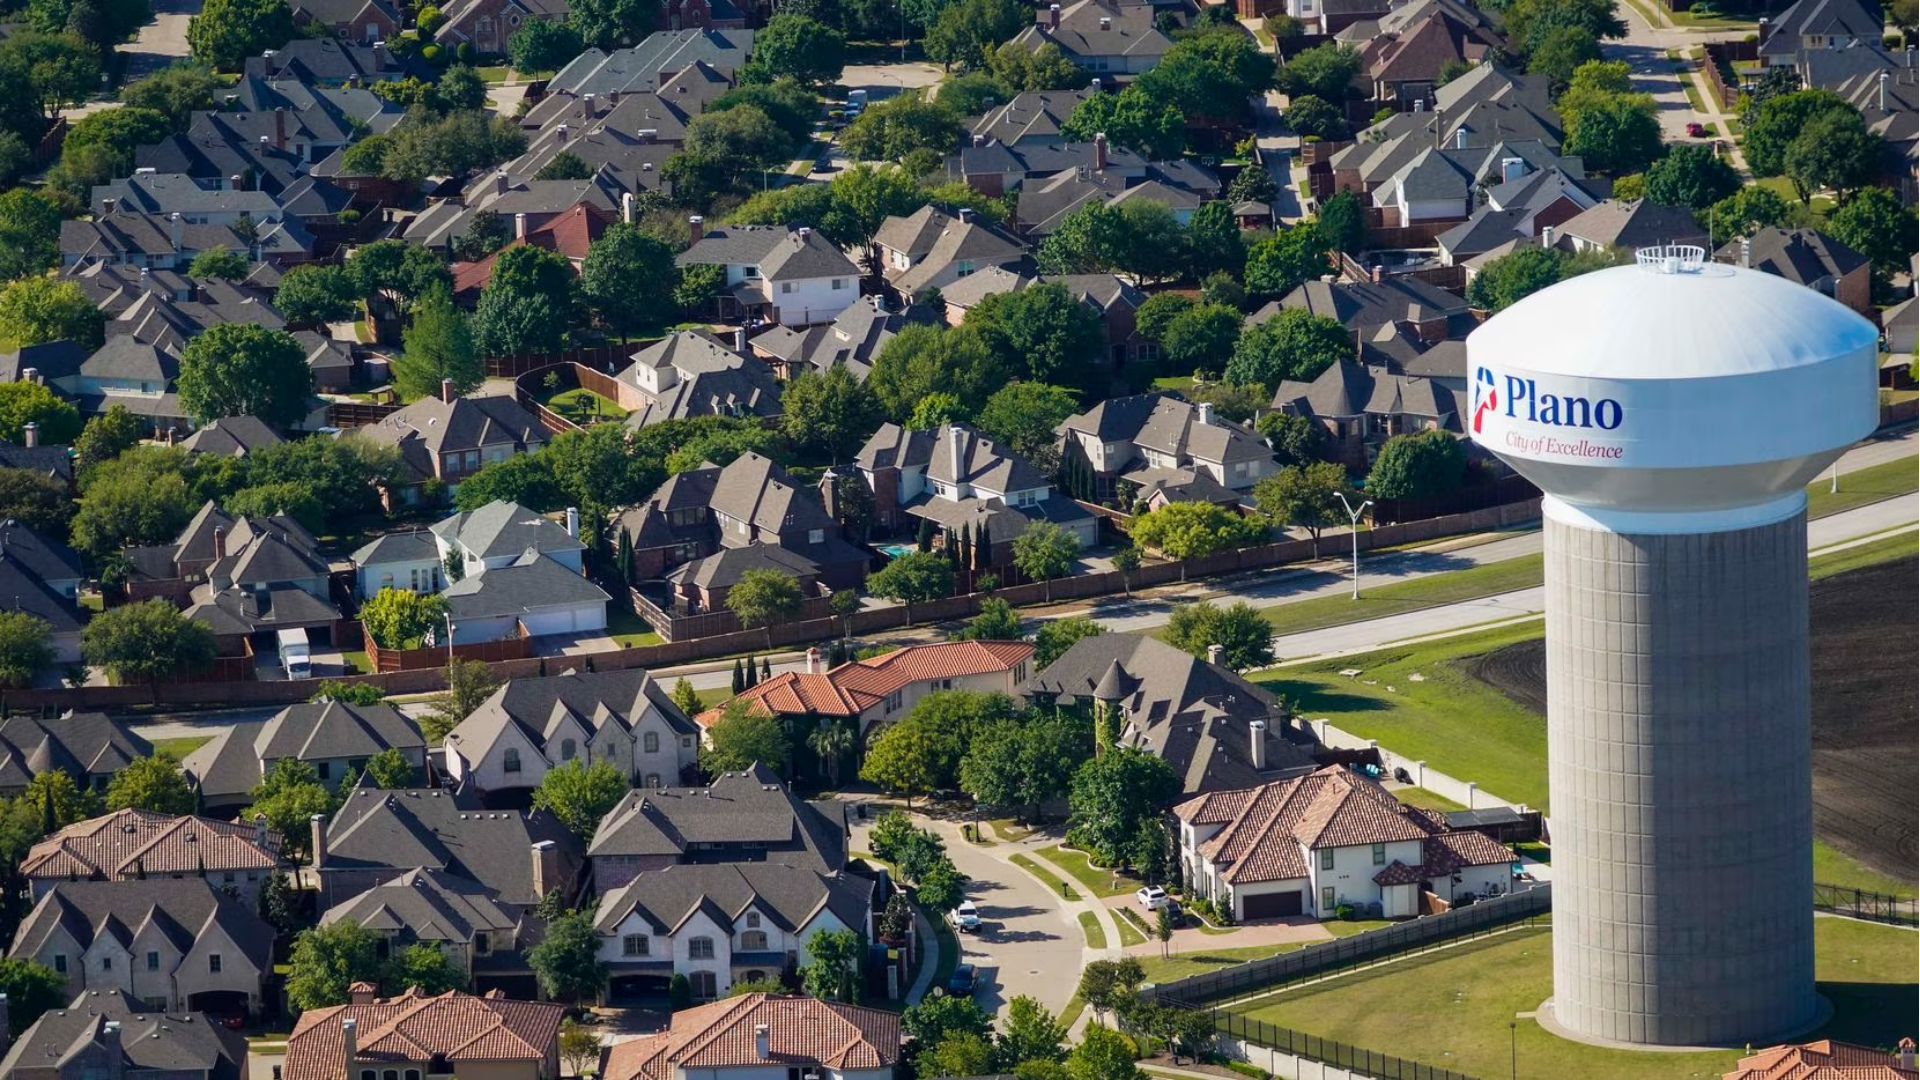
The Plano Real Estate Market Report
A comprehensive analysis of Plano's housing market performance, trends, and insights
Where Did All the Listings Go?
And more importantly: what happened to the ones that didn't sell?
The 2025 Plano Market in Numbers
Single Family Homes · All Plano · January 1 – December 31, 2025
If you only read the headlines, you'd think Plano's real estate market had a terrible year in 2025. But here's what the data actually shows: Plano closed 2,297 home sales — exceeding both 2024 and 2023. Median prices increased. And Plano outperformed its Collin County neighbors — the only major city where median prices didn't decline year-over-year.
The real story of 2025? Plano's market didn't fail. It balanced. Price discovery replaced bidding wars. Buyers regained negotiating power. Sellers learned that strategic positioning matters again.
For the first time in years, both buyers and sellers can win — but only if they understand the data behind the headlines.
The Big Picture: Plano by the Numbers
Overall Market Performance
| Year | Total Sales | YoY Change | Median Price | YoY Change |
|---|---|---|---|---|
| 2023 | 2,060 | — | $533,000 | — |
| 2024 | 2,196 | +136 (+6.6%) | $538,000 | +$5,000 (+0.9%) |
| 2025 | 2,297 | +101 (+4.6%) | $540,000 | +$2,000 (+0.4%) |
Single Family Homes · All Plano · January 1 – December 31, 2025
Plano's sales volume has grown consistently over the three-year period, with 2025 marking the strongest year for total transactions despite broader market narratives of slowdown. The growth rate moderated from 6.6% to 4.6%, reflecting market normalization rather than contraction.
After rapid appreciation in 2020–2022, Plano's median price has stabilized in a narrow band around $535K–$540K. The modest $2,000 increase in 2025 represents healthy stability — prices neither crashed nor inflated beyond sustainable levels.
Market Velocity Tells the Real Story
The most visible shift? Time. Homes that sold in under two weeks in 2023 now average 25 days on market. This isn't weakness — it's functional market dynamics returning. The 99% → 97% sold-to-list ratio reflects increased price discovery. Buyers regained modest negotiating power, particularly on properties lingering beyond 30 days.
| Metric | 2023 | 2024 | 2025 | Change |
|---|---|---|---|---|
| Median Days on Market | 13 | 15 | 25 | +10 days |
| Sold vs List Price | 99% | 98% | 97% | -1% |
Supply & Demand Dynamics
The Supply Surge
Plano saw 13% more listings than the historical average — more than any year in the last decade. Throughout most of 2025, new listings exceeded historical averages week after week.
The Year in Two Acts
Despite increased listings, buyer demand remained steady. However, the relationship between new supply and absorption shifted as the year progressed.
The first half of 2025 saw inventory accumulate as new listings outpaced buyer contracts. By mid-year, the market found its clearing price. Properties priced to current conditions began moving, and supply-demand normalized.
This isn't market failure — it's price discovery in action.
Understanding Failed Listings in Context
In 2025, 3,510 listings came to market in Plano representing 3,031 unique properties — the difference reflects homes that were listed multiple times after cancellations or expirations.
Listings vs Houses: A Critical Distinction
A listing represents an event — when a property comes to market. A unique house can generate multiple listing events if it's cancelled and relisted. When analyzing market health, it's essential to distinguish between listing activity (events) and actual inventory (unique properties).
Of these, 1,048 listing events represented 870 unique properties that failed to sell. That 178-property difference? Sellers who tried multiple times to find the right price.
What happened to the 870 properties that failed?
Of the properties that cancelled or expired, about one in three recovered — meaning they came back to the market, many of which achieved a sale in 2025 — through price adjustments, improvements, or timing changes. The remaining 616 chose to sit out rather than meet market pricing.
| Outcome | Properties | What This Means |
|---|---|---|
| Relisted & Sold | 137 | Successfully adjusted and closed |
| Under Contract | 29 | Second (or third) attempt working |
| Active Again | 88 | Currently marketing |
| Subtotal — Recovered | 254 (29%) | Sellers who adapted to market |
| Sat Out Entirely | 616 (71%) | Shadow inventory |
Cancelled vs Expired: Different Behaviors
| Type | Events | Unique Properties | Recovery Rate | Sold After Relisting |
|---|---|---|---|---|
| Cancelled | 748 | ~640* | 32% (~205) | 125 |
| Expired | 300 | ~230* | 21% (~49) | 12 |
*Approximate — some properties both cancelled and expired during 2025; each property counted only once in the 870 total
Cancelled listings recovered, meaning reengaged with the market, more often (32%) than expired (21%), suggesting sellers who proactively withdrew were more willing to adapt than those who let listings expire.
The Shadow Inventory: 616 Properties
These homes represent 3.2 months of normal sales volume sitting on the sidelines. They're not distressed — they're sellers who chose to wait rather than adjust to market pricing. Will they return in 2026? Only if expectations reset or circumstances change.
The market shifted from scarcity to selection. 616 properties in shadow inventory plus normal ongoing listings = meaningful choice without bidding wars.
29% of failed listings adapted and found success. The market rewards flexibility. The 71% who sat out chose to wait — valid if circumstances allow, but you'll compete with them if you re-enter in 2026.
For the Market: Failed listings indicate price discovery, not dysfunction. 76% of properties either sold or are actively working toward sale. This is equilibrium, not crisis.
Understanding the Layers
Not all price ranges performed equally in 2025. Understanding segment-specific dynamics is critical for strategic decisions.
Price Tier Performance
| Price Segment | Homes Sold | % of Market | Median Price | Median DOM | Sold v OLP | Mos Supply* |
|---|---|---|---|---|---|---|
| Entry-Level (<$400K) | 469 | 20% | $350,000 | 23 | 95.6% | 1.9 |
| Mid-Market ($400K–$750K) | 1,386 | 60% | $540,000 | 28 | 97.1% | 2.5 |
| High-End ($750K–$1.5M) | 381 | 17% | $875,000 | 24 | 96.6% | 2.1 |
| Luxury ($1.5M+) | 61 | 3% | $2,200,000 | 22 | 96.1% | 2.2 |
*Months of Supply as of December 2025
Entry-Level (<$400K): Shrinking fast — down from 60% of sales in 2020 to just 20% in 2025. Lower sold-to-list (95.6%) gives buyers leverage on older properties. First-time buyers increasingly need $400K+ to access Plano.
Mid-Market ($400K–$750K): The market's heartbeat — 60% of all transactions. Median DOM of 28 days. This isn't "list and it's gone" anymore. Price it right, give it a month.
High-End ($750K–$1.5M): Budget reality check — median sold price is $875K, not $750K. With 96.6% sold-to-list, you need $850K–$900K to compete for median properties in this tier.
Luxury ($1.5M+): Just 3% of market but efficient. Median 22 days — well-positioned luxury moved faster than mid-market homes. Limited inventory meets decisive $2M+ buyers.
Geographic Performance
| Area | Homes Sold | Median Price | Median PPSF | Median DOM | YoY Price |
|---|---|---|---|---|---|
| East Plano | 378 | $413,250 | $203.30 | 29 | -2% |
| Central Plano | 1,247 | $505,000 | $213.35 | 25 | -1% |
| West Plano | 672 | $729,500 | $241.56 | 25 | -1% |
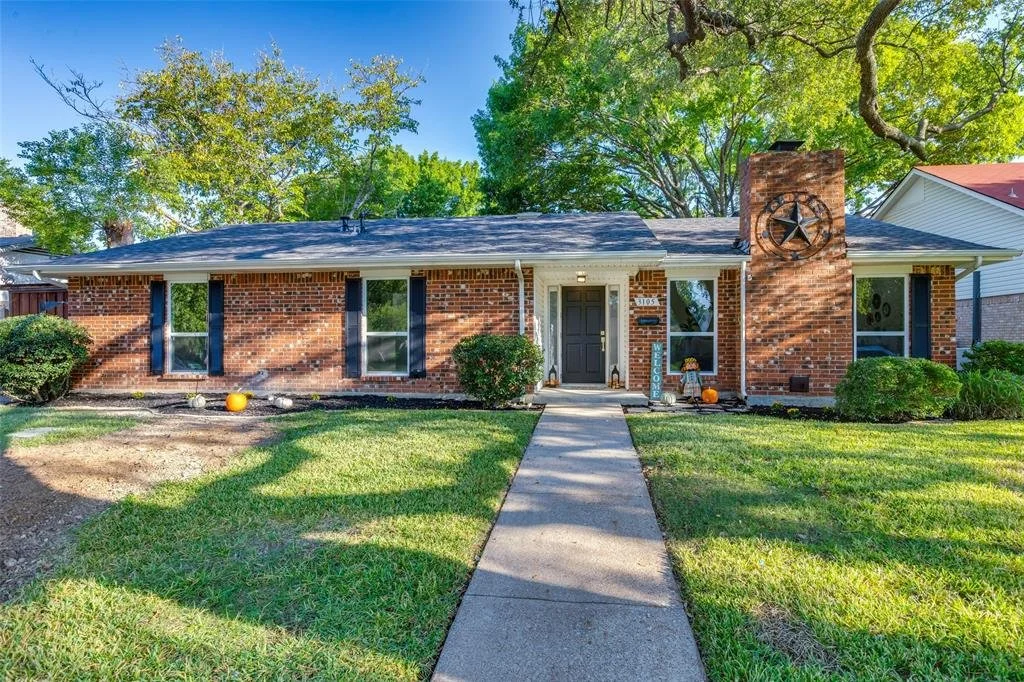
East Plano: Established Value
East Plano represents the city's most affordable entry point, with homes typically built in the 1970s–1990s in mature, tree-lined neighborhoods. These established communities offer excellent value for first-time buyers and families prioritizing Plano ISD schools while maintaining budget discipline.
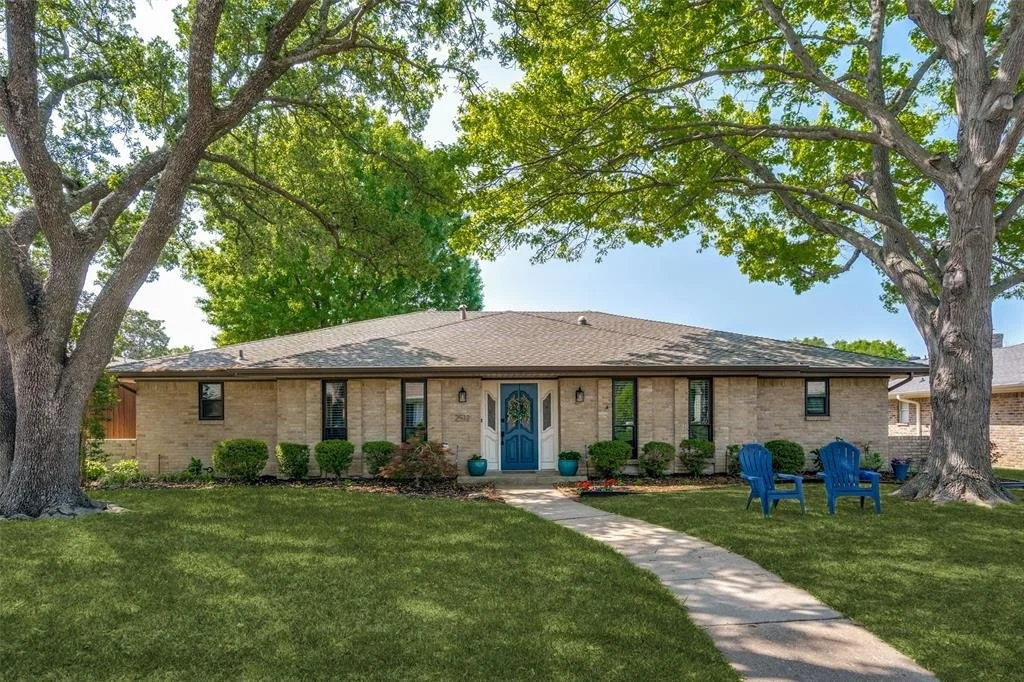
Central Plano: The Balanced Middle
Central Plano is the city's geographic and demographic center, representing the "typical" Plano homebuyer. This area balances maturity with relative modernity, offering a mix of 1980s–2000s neighborhoods with complete infrastructure and established amenities.
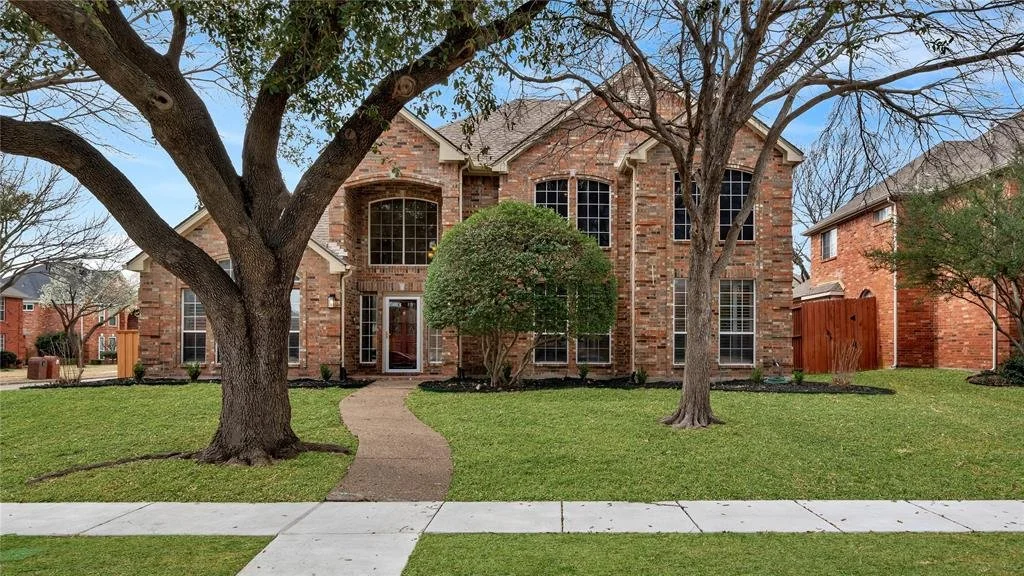
West Plano: Premium Positioning
West Plano commands a premium for proximity to Legacy Drive corporate headquarters, newer construction, and luxury neighborhood concentration. Despite being the smallest geographic area by sales volume, West Plano generates the highest median prices and price-per-square-foot.
This report provides city-wide and regional analysis, but every Plano neighborhood has its own micro-market dynamics.
Your strategy should match your segment. Entry-level buyers face different competition than luxury buyers. Understanding your specific market tier's supply dynamics, typical DOM, and negotiation leverage is essential for success.
Don't rely on overall Plano statistics to price your home. A $450K property in Central Plano operates in a completely different market than a $1.8M home in West Plano. Segment-specific comps and DOM expectations should drive your strategy.
Notable Market Patterns
Beyond the headlines, deeper patterns reveal how Plano's market actually functions in 2025.
The Price Discovery Process
Most sellers learned initial pricing matters. The market negotiates through time and price reductions, not buyer lowball offers.
| Days on Market | Sold vs Original List | Sold vs Last List | # of Sales |
|---|---|---|---|
| 0–7 days | 100.0% | 100.0% | 595 |
| 8–14 days | 98.7% | 98.8% | 246 |
| 15–30 days | 97.2% | 98.0% | 349 |
| 31–60 days | 95.4% | 97.8% | 429 |
| 61–90 days | 93.0% | 97.2% | 234 |
| 90+ days | 90.2% | 97.1% | 322 |
Excludes contracts written before January 1, 2025
The divergence between these two columns reveals who's doing the negotiating: sellers through price reductions (left), not buyers at contract (right).
The pattern: Properties on market 90+ days sold for 90% of original list but 97% of final list. That 7-point gap? Seller price reductions. Buyers then negotiated 2–3% off the adjusted price.
One in four Plano homes (26%) sold in the first week at full asking — bypassing the entire price reduction cycle by pricing correctly from day one.
Texas Non-Disclosure Reality
Online prices lie. Or rather, they show incomplete truth.
Texas is a non-disclosure state, meaning Zillow, Realtor.com, and other sites display the last list price, not the final sold price. This creates pricing illusions.
Example: Your neighbor's home shows "Sold: $550,000" online. The actual story:
- Started at $585,000
- Reduced to $550,000 after 45 days
- Sold for $535,000 (97% of adjusted list)
- Netted $527,000 after seller concessions
The real comparable is $527K, not $550K. But most sellers price based on online numbers, not actual net proceeds — leading to systematic overpricing.
Bottom line: Price it right on day one or watch the market force you there over three months. The difference between 100% and 90% of asking is nearly 10% of your home's value.
Seller Concessions
Seller concessions — credits toward buyer closing costs or repairs — became standard in 2025. 51% of sales included them (up from 43% in 2023), averaging $6,000 (1% of sale price). While credits are often added after inspections, more buyers are now negotiating concessions as part of their initial offer to help buy-down interest rates and improve their affordability.
| Metric | 2023 | 2024 | 2025 |
|---|---|---|---|
| % of Sales with Concessions | 43% | 45% | 51% |
| Median Concession Amount | $5,000 | $5,000 | $6,000 |
| As % of Sale Price | 0.86% | 0.90% | 1.04% |
The Plano Context: Plano has been less impacted by this trend compared to the larger DFW market overall. For a deep dive on seller concessions and their role in today's market, check out our recent Seller Concessions blog post.
Properties moving quickly (0–7 days) still involved concessions 47% of the time, though amounts were lower ($4,250). Extended market time increased concession amounts to $7,500–$9,300, particularly in the 61–90 day window.
| Days on Market | Avg Concession | % with Concessions |
|---|---|---|
| 0–7 days | $4,250 | 47% |
| 8–14 days | $5,000 | 50% |
| 15–30 days | $6,710 | 52% |
| 31–60 days | $6,650 | 51% |
| 61–90 days | $9,300 | 52% |
| 90+ days | $7,500 | 55% |
The Hidden Price Reduction
Concessions function as effective price reductions because they reduce net proceeds. A home that sells for $550,000 with $8,000 in concessions nets the seller $542,000 — making the real comparable $542,000, not $550,000.
While concession data is available in MLS records, seller credits aren't displayed publicly online. Many agents forget to research this when pulling comparables, leading to inflated pricing expectations. Always adjust for concessions to understand true net selling prices.
Budget for it: Sellers should expect at least 1% of sale price for concessions. These aren't signs of buyer aggression, they're standard elements in a balanced market.
Seasonality: Timing the Plano Market
2025 broke traditional seasonal patterns. New listings exceeded historical averages in 11 of 12 months, yet closings remained remarkably stable year-round.
Unlike typical years where closings peak sharply in spring/summer and decline in fall/winter, 2025 showed unusual stability. Monthly closings varied by only 7 percentage points (6%–13% of annual volume), demonstrating sustained buyer demand throughout the year.
The Spring Paradox
458 new listings hit the market in May 2025, yet only 194 closed the following month — a greater than 2:1 ratio. Spring brought maximum buyer traffic but also maximum seller competition. Properties that weren't priced correctly faced extended market time as inventory accumulated around them.
The Timing Takeaway
Conventional wisdom says "list in spring for maximum exposure." The 2025 data tells a different story:
- Spring (Mar–May): Most active listings, but 40% more competition than historical average
- Fall/Winter: 50% fewer competing properties, motivated sellers
- Year-round demand: No month exceeded 10% of annual sales — the market functions consistently
Bottom line: Timing creates opportunities, but pricing matters more. A well-priced home in December outperforms an overpriced home in April. Sustained year-round demand means success depends on meeting market expectations, not gaming the calendar.
What These Patterns Mean Together
Price it right from day one (0–7 days = 100% of asking | 90+ days = 90%). Budget 1%+ for buyer concessions. Spring = maximum exposure but maximum competition. Market rewards flexibility over timing games.
Leverage exists in extended DOM (30+ days), not fresh listings. Target properties that have already reduced prices — expect to pay 97–98% of current asking. Fall/winter = less competition from other buyers. Online "sold" prices mislead — factor in reductions and concessions.
Data-driven decisions beat hope-based strategies every time.
Plano in Context
Plano competes primarily with other Collin County cities — not with Fort Worth or southern Dallas suburbs. Understanding how Plano performed relative to its competitive set reveals where the market stands.
Plano Among Its Peers
| City | Median Price | YoY Change | DOM | Homes Sold | Sold vs OLP |
|---|---|---|---|---|---|
| Plano | $540,000 | +$2,000 | 25 | 2,297 | 96.8% |
| Frisco | $690,000 | -$6,000 | 36 | 2,162 | 95.7% |
| Allen | $525,000 | -$10,000 | 29 | 1,020 | 96.8% |
| McKinney | $495,000 | -$34,999 | 37 | 3,404 | 95.4% |
| Prosper | $857,500 | -$27,500 | 52 | 792 | 93.3% |
| Celina | $558,825 | -$90,367 | 63 | 1,484 | 92.1% |
For Context — Broader DFW
DFW Metro Area: $393,410 (-1.7% YoY) · DFW Days on Market: 38 days · Collin County: $467,860
The Plano Advantage
Price Stability: Plano was the only neighboring city where median prices increased year-over-year (+$2,000). While Frisco dropped $10K, McKinney fell $35K, and Celina plummeted $90K, Plano held firm. The difference? Minimal new construction (just 19 sales, <1% of market). Neighboring cities with aggressive building activity saw builders shift to less expensive products, dragging down median prices. Plano's resale-dominated market avoided this downward pressure.
Market Velocity: At 25 days median DOM, Plano homes sold faster than every neighboring city. McKinney homes took 48% longer, Frisco 40% longer, Prosper 104% longer. Faster absorption indicates efficient price discovery and sustained buyer demand.
Pricing Power: Plano's 96.8% sold-to-original-list ratio outperformed most neighbors, indicating buyers compete for quality inventory rather than waiting for desperate sellers.
The Plano Value Equation
Plano offers the mature option — complete infrastructure, proven schools, corporate proximity — often at better value than newer alternatives. Pay $45K more than McKinney for faster commutes and established amenities, or save $145K vs Frisco while gaining established neighborhoods.
Compete on established quality and convenience, not "newest development" appeal. Emphasize mature landscaping, proven schools, employment corridor proximity, and market liquidity (sell in 25 days vs 51+ in outer suburbs).
Highest-Priced Sales of 2025

A 6.7-acre gated estate with a 12,335 sq ft main residence combining privacy and natural beauty that evokes hill country vibes. Features include a spring-fed creek, private one-acre stocked lake, resort-style negative-edge heated pool, lighted tennis court, and 9-car climate-controlled garage. The one-level Austin-stone home includes a 678-bottle wine cellar and award-winning 20-seat home theater.
View property details
A 14,738 sq ft contemporary estate on 1.5 acres in the exclusive guard-gated Kings Gate community. Features include an elevator, sound-proof media room, steam shower, full exercise room, tennis-basketball court, wine tasting room, and detached two-story cabana guest suite. Smart home system controls every aspect of this meticulously designed property.
View property details
Over 10,900 sq ft of luxury on nearly 0.8 acres in prestigious Willow Bend Country Club. Dramatic architecture with grand staircase, floor-to-ceiling windows, and 7 fireplaces. Features include dual primary suites, complete 1st-floor guest suite with full kitchen, cedar wood sauna with steam shower, and resort-style outdoor living with heated pool and spa.
View property details
Brand new 7,067 sq ft estate completed in 2025 on over 0.75 acres in gated, guarded Normandy Estates. Modern transitional design with suspended architectural staircase, 6 bedrooms including primary plus two additional on first floor, primary suite with private exercise room, exquisite steam shower, scullery with built-in coffee maker and ice machine, and 4-car garage.
View property details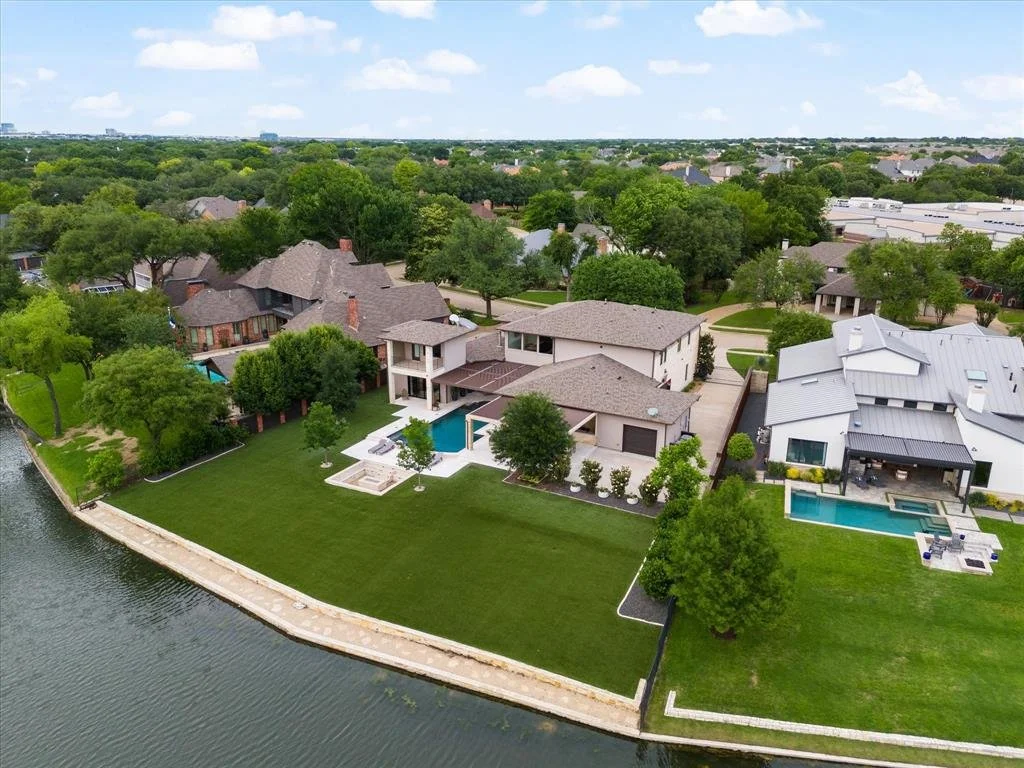
A rare half-acre waterfront home in prestigious Willow Bend Lakes. 5,601 sq ft contemporary residence with 2017 construction and recent floor-to-ceiling upgrades. Standout amenities include a $250K commercial louvre system spanning 2,000 sq ft of covered outdoor area, outdoor kitchen, pool and spa, sunken fire pit, custom iron glass windows, and gourmet kitchen with four ovens.
View property detailsThe Ultra-Luxury Market ($2.5M+)
22 sales above $2.5M in 2025 (<1% of transactions). The top 5 alone: $38.63M in volume. All concentrated in West Plano's most prestigious communities — Kings Gate, Willow Bend Country Club, Normandy Estates, Willow Bend Lakes, and private gated estates — demonstrating sustained luxury demand despite broader market normalization.
Top-Performing Neighborhoods
By Transaction Volume — These neighborhoods led Plano in sales activity, reflecting sustained buyer interest and healthy inventory turnover.
| # | Neighborhood | Sales | Median Price | Median DOM |
|---|---|---|---|---|
| 1 | Dallas North Estates | 74 | $430,000 | 32 |
| 2 | Hunter's Glen | 64 | $554,750 | 24 |
| 3 | Park Forest | 54 | $366,675 | 35 |
| 4 | Park Forest North | 48 | $360,000 | 25 |
| 5 | Cross Creek | 47 | $390,000 | 17 |
| 6 | Cloisters | 44 | $525,000 | 22 |
| 7 | Whiffletree | 39 | $780,000 | 34 |
| 8 | Los Rios | 32 | $438,000 | 32 |
| 9 | Parker Road Estates | 29 | $440,000 | 22 |
| 10 | Spring Creek Parkway Estates | 27 | $455,000 | 16 |
By Market Velocity — Properties in these neighborhoods spent the least time on market, indicating pricing efficiency, strong demand, and buyer urgency.
| # | Neighborhood | Sales | Median Price | Median DOM |
|---|---|---|---|---|
| 1 | Willow Bend Lakes | 15 | $1,350,000 | 3 |
| 2 | Heatherwood | 13 | $383,000 | 8 |
| 3 | Briarmeade | 17 | $566,900 | 9 |
| 4 | Highlands of Preston Ridge | 12 | $757,000 | 10 |
| 5 | Steeplechase | 12 | $827,500 | 10 |
| 6 | Ridgewood | 24 | $336,819 | 12 |
| 7 | The Hills At Prestonwood | 20 | $664,325 | 15 |
| 8 | Country Place | 12 | $551,950 | 15 |
| 9 | Spring Creek Parkway Estates | 27 | $455,000 | 16 |
| 10 | Spring Ridge | 27 | $640,000 | 16 |
Qualified neighborhoods: 12+ sales in 2025 (minimum one sale per month average)
The Volume-Velocity Sweet Spot
Spring Creek Parkway Estates appears on both lists — high transaction volume AND fast market velocity. This represents one of Plano's most liquid markets where sellers can expect competitive pricing and quick sales.
How your specific neighborhood performed in 2025. Which streets sold fastest. What price adjustments were typical. How your home's value compares to recent sales.
Notable Transactions
The Most Persistent Property: 423 days on market before closing. Originally listed at $861K by Opendoor, reduced 13 times to $716K, then contracted within 2 days. The lesson? Time on market doesn't solve pricing problems — accurate pricing does.
New Construction: Just 19 homes (<1% of market), median $545,990, mostly in Mustang Square (West Plano). Resale properties dominated 2025. Expect more new construction in 2026–2027.
About This Analysis
This analysis draws on 11+ years of Plano market data tracked through proprietary Power BI systems, analyzing 40,000+ transactions across all neighborhoods and price tiers. Analysis includes 2025 performance data and multi-year historical trends via NTREIS MLS. Covers single-family home sales only (excludes townhomes, condos, land sales, leases).
Explore the data yourself: Plano Market Data Archive
What's Next for Plano?
2025's data raises critical questions for buyers and sellers: Will shadow inventory return? How will different price segments perform? What timing strategies work best in 2026? Will Plano maintain its competitive edge in DFW?
The 2026 Plano Housing Outlook
Forward-looking projections and strategic guidance for the year ahead.

Matt Haistings
Market intelligence, not just market access.
Every home and situation is unique. The data provides context — your specific circumstances deserve personalized analysis.
Email: matt@haistingsre.com · Phone: 469.305.0750